Pair trade idea MGL n IGLIGL n MGL have formed inside bars,
Take opposite positions, relative to one another
If longed in MGL look for short in IGL, vice versa
Inside bar trade
Short if PDL is broken with SL at PDH
Long if PDH is broken with SL at PDL
Search in ideas for "INSIDE BAR"

PF trade at UML Inside Bar.2 down sloping Pitchforks at the same frequency are capturing the price movement nicely. Price got declined after retesting the upper median line has formed the Inside bar which is also suggesting the weakness. If price trades below the low of today's bar one can short the stock by providing the SL of 280 on closing basis. Target expectations Median Line.
Disclaimer : All stock recommendations and comments are my personnel view, please take financial consultancy for trading decision.

Range Breakout Failure on the Daily! EURUSD Short.Hello Traders!
1. We see a range made by the EURUSD market on the daily timeframe.
2. There was a clear breakout with the closing of the breakout bar way above the range.
3. A bearish inside bar was formed right after it.
4. Market has also tested 88.6 per cent fib.
5. Once the low of the mother bar (breakout bar) is broken, we can see movement downwards till the market orange zone.
6. Remember, this is on the daily timeframe, so delivering the target may take some time.
Do use proper risk management.
Happy Trading!
Profits,
Market's Mechanic.

oberoi reality - short for 10 %on daily charts ,
price breached into the pivot level confirming resisatnce
price breached 18 day EMA
price forming a bearish inside bar below 18 day EMA
bearish insied bar followed by bearish engulfing bar
pric efacing resisatance at 18 day EMA for last 5 days
target and SL marked

SBICARD -long for 10 % valuation is expensive at current level , so the suggestion is purely techincal
1. inside bar formation above 18 day EMA followed by a bullish engulfing bar
2.this bullsih engulfing bar closed above 200 day EMA with decent volumes
3.18 day EMA crossed 50 and 100 day EMA
4. Rounding bottom BO
target and SL marked

TechMTechM reversed from a harmonic level(635-640) and made a bullish engulfing.
Next day it made an inside bar and closed below the resistance at 607.
Aggressive traders can sell below day low of engulfing bar(599) for target 583 with SL 606.
Safe traders can sell on low of engulfing bar which is 588 and trail to cost when it goes 583 (there is a support),
when this support breaks, the next target is 565.
As IT sector is bullish, this may never trigger or can be risky, hence trail as soon as you are in profit.
TechM has a maxpain of 580 and OI and 650 CE and 550 CE.
My view can go wrong as well. Please be careful.
Disclaimer: I am not a SEBI Registered Analyst. This is for educational purpose. Please take position after consulting your advisor.

Nifty TRENDnifty has formed big bar, reversal bar, Inside bar on daily chart.
all this created when shark fish is swimming in the water
be ready for one-way move in nifty for at least on week

Redington: Inside bar formation on 15 minutes time frameRedington Ltd is consolidating well near breakout zone. Stock is trading inside first 15 minute candle of today. Keep on radar for closing above 225.

CAMS BullishAs we see price is at demand zone and formed a bullish harmonic pattern along with Inside candlestick pattern, once break out of Inside bar one can take a long position just a view not a reco... levels are on chart

Jasch Industries: Forming multiple inside bar on WTFJasch Industries is looking good on weekly time frame. Stock is trading near support zone and forming multiple inside bar. Seems good accumulation is going on for next run up. Keep on radar for reversal candle.

Granules India Breakout on monthly time frameAs you can see here Granules India chart, what does this chart show?
This chart shows us that it has given a breakout of a beautiful pattern i.e. flag and pole on a monthly time frame. As you can see on the weekly time frame, the stock had broken its nearest resistance and now it is ready to move more on the upside.
So now we can plan an entry for upside momentum, from the last two days this stock has been consolidating inside the breakout candle, making inside bars on a daily time frame. So our entry will be above the high of the mother candle i.e. 390 and our stop-loss will be of 30 points. The first target will be ATH(all-time high).
Hold this for a long time as the breakout is on a monthly time frame.
I'm not sebi registered so this is only for educational purpose, do your analysis first.

TPL Plastech: Forming multiple Inside Bar & near BOTPL Plastech is consolidating and forming multiple inside bar. Keep on radar for breakout. Seems good consolidation is going on & stock is getting ready to break consolidation range.

8884 iOi set upReason for long
a) Inside outside inside bar set up: Usually, the break of range candle is the entry and range low is sl either for upside or downside.
b) Price for upside is powered by super vwap, super trend, QQE and channel breakout
c) further the price is headed towards weekly high
d) HSP is another chart pattern that entice for long
SL compulsory

AGI: Ready for another breakout?!CMP: 732
- Trading inside the 17 August candle
- Coiling up near All-Time High
✅ 3 consecutive month-low volume days
✅ Weekly Inside Bar
✅ NR7
I will try to enter above 740 with an SL of 3-4%

Nutaral condition inside bar pattern Inside candle pattern strategy
Buy up
Sell when down
1:2 RR ratio will achieve

Ruchira Paper: Inside bar breakoutRuchira paper is consolidating and forming multiple inside bars. Seems health accumulation is going on. Recently Company has declared decent results for FY 22-23. Keep on radar.

Understanding Inside Bar setup concept with trade example I daily make educational content videos for financial markets

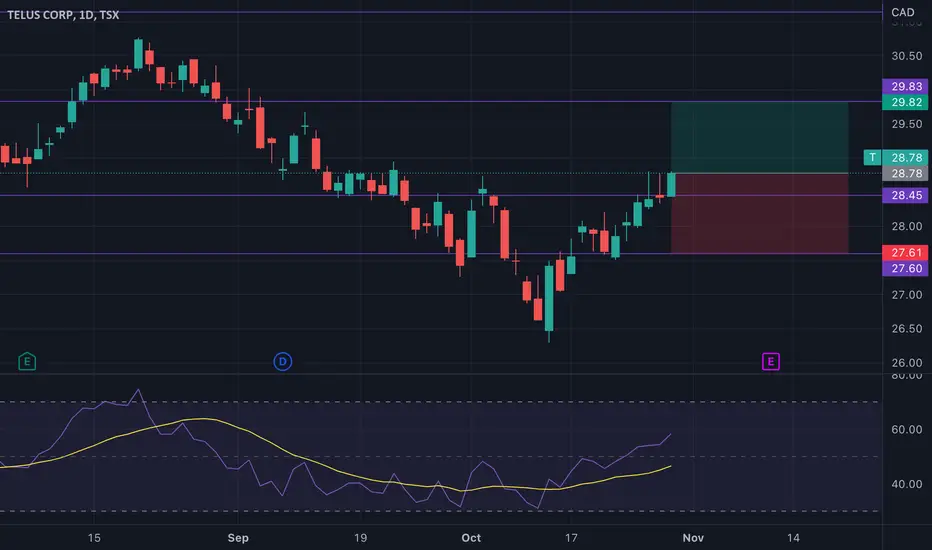
Inside Candle TelusI have been actively monitoring the inside bar pattern working on various Canadian stocks, I am just journalising and checking the win ratio for the same before I invest.
NIFTY Inside Bar Candle Strategy trade NIFTY has formed a nice Inside Candle day befor eyesterday.
If NIFTY breaks above 17700 :-
Carry forward buy above 17700 for target 17922/18036
IF NIFTY breaks below 17470 :-
Carry forward sell below 17468 for target 17241/17127
Breaks should be on the closing basis of the daily candle OR trade can be taken after 3:00 /3:15 PM if levels are broken.
This is positional trade and can be achieved in 3-4 days after breakout/breakdown. Do Not buy options to make use of this.

Indusind bank After forming a failed head and shoulder pattern on weekly candle chart now gave a fresh breakout on daily chart - inside bar
It may move upside
Stoploss low of inside candle

NIFTY AND BANKNIFTY WEEKLY UPDATEGOOD MORNING MEMBERS
TIME FOR WEEKLY NIFTY UPDATE
NIFTY INDEX
-after breaking out of range last week
-nifty consolidated in the range of 16470-16700
-i will not conider the open on friday as we managed to close inside the trading range again
-reliance is batting for the bulls
-global uncertainty will create movement in our market
-oil back above $120 not good signs
-rbi policy in the week banknifty looking weaker
keep things simple
-nifty if closes below 16380 will look for aggressive shorts
-reason being that market is for now is taking support at resistance turned support zone of 16380-16420
-on safer side i will wait for a close below 16380
-if does there is a huge possibility of breaking below 15750-16420 trading zone on downside
-as pattern break will fail
-on the upside nifty will be a buy above 16700 only
-we need a daily close above 16700
-but on the upside major hurdle comes at 16850-16970
-on downside direct support@16000-1570
-things are not looking good for now
-but we will track nifty action this week
BANKNIFTY INDEX
-double top formation on hourly/2h chart is visible
-crucial support @34800
-carried overnight shorts in banknifty
-rising dollar/rising crude prices/yields are now again started trading above 2.9
-banknifty support zone is 34800-34650
-resistance at 35500-35600
-if market closes below 34700 today
-it will open up downside for target of 34200-33950
note:-
*banknifty on daily chart made a bearish engulfing pattern
*but important thing is it trapped bulls
*as it covered the three consecutive inside bar pattern
banknifty daily chart
banknifty 2h chart

BANK NIFTY again it is inside bar and nr7 day.Bank nifty delivers when all starts hating it.
this down turn of bank nifty exactly takes support
at the 200 period moving average in 4 hrs time frame.(the chart I have published in 4 hrs time frame)
It appears 2 nd wave retraced 78.6 percent of 1st wave.
1st wave being a leading diogonal.
Bank nifty may come out of congestion with in coming days.
I had stated in one of my post how to trade inside bar.
It is not certain that bank nifty will have huge move next day
last time it had formed 2 consecutive nr7 days.
Let us see this time 2 nd nr7 day takes place or not.
It appears this down turn of bank nifty is 2 nd wave of fifth wave .
No need to say we are in the final fifth wave of larger degree.(please go through the attached chart)
please go through my weekly chart of bank nifty.
don't forget to like my post. follow me to get updates.

CDSL Bullish Inside BarAfter a mighty run up CDSL has formed a manipulative candle (marked as shakeout in chart) followed by an inside bar.
Conviction is that it will run up further after brief accumulation.
